CST results -- my classes
I love data. I freakin love it. I love charting pre and post results on everything from writing to fluency, I love seeing student growth and showing it to them. It is also a necessary part of being a teacher. "I really feel my students have progressed this year." Fart all over that, show me the numbers, or the work product, prove it.
California Standards Test (CST) results have been partially released -- they are not yet available on-line. As a teacher, I value this test. I am no fan of George II, nor am I a fan of his continual production of unfunded mandates, but in principle NCLB (again "nickel-B") is unflawed. School districts, schools, and especially teachers need to be held responsible and accountable for the learning of their students (and lack thereof). What we do is too important to leave to gaseous feelings or vague assertions. What did you do with all those kids for all those hours? And yeah, sure, standardized tests are flawed in many ways, but they also tend to represent a skill set our kids need, and, moreover, function as "academic gatekeepers" (that's not my terminology) for future academic / life opportunities, including access to college track classes, electives, and university matriculation. We do our students, especially our poor, non-white, ELL students, a disfavor by not adequately preparing them for the manner in which they will be assessed throughout their lives.
In California, student scores fall into one of five ranked categories:
Far Below Basic (FBB)
Below Basic (BB)
Basic (B)
proficient (P)
Advanced (A)
Many educational tools focus only on the number of proficient students. This is near-sighted and harmful. An accurate analysis of these results charts growth. Given a student's starting point, however low, where did they finish? Do you reward the person with the fastest 100m dash time if they started 50m into the race while the competition was 400m farther back? We should look not to where kids finished, but rather how far they traveled.
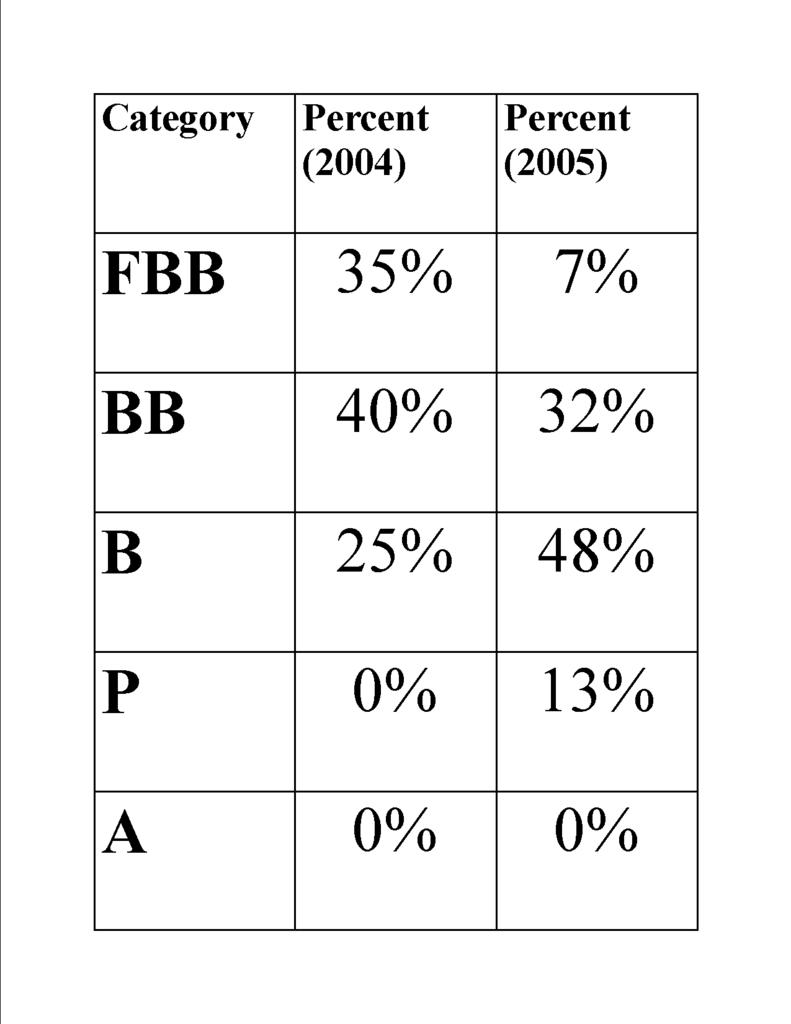
Here's what my kids did in 2004 and then 2005, when they were in my classroom

Okay. This data shows that 75% of my students started last years scoring in the lowest two categories, and that this number was reduced by nearly half, to 39%. Moreover, zero students were proficient at the start of last year, and by the end 13% were. The students that are represented by that 13% demonstrated over three years growth in a single school year. Not one of them is considered fluent in English by the state of California.
This data makes me happy. Obviously there's a lot of kids still scoring very low, and not quite as much universal movement as I had hoped for, but the amount of kids who jumped from FBB to B in a single year is incredible, and I'm really happy to see that almost half my students (the B's) will enter eighth grade with a shot to finish the year proficient, and therefore entering high school as college track students. The 7% in FBB I thought would be 0-3%, and the 32% in BB I thought would be more like 25%. I can justify some of this -- I had as few as six weeks with some of these kids, two of them should have been in SDC environments, etc. -- but I'll own this data.
Obviously, there is huge room and huge necessity for increased growth, but I think the gains here justified my salary. Moreover, they justify the many alterations, substitutions, and supplements I bring to my terrible scripted, mandated, approved, official curriculum. These results, as imperfect as they are, function as an arrow in thequiver, something I can pull out and say, look, it's working, back off with your passing guides and testing calendars.
California Standards Test (CST) results have been partially released -- they are not yet available on-line. As a teacher, I value this test. I am no fan of George II, nor am I a fan of his continual production of unfunded mandates, but in principle NCLB (again "nickel-B") is unflawed. School districts, schools, and especially teachers need to be held responsible and accountable for the learning of their students (and lack thereof). What we do is too important to leave to gaseous feelings or vague assertions. What did you do with all those kids for all those hours? And yeah, sure, standardized tests are flawed in many ways, but they also tend to represent a skill set our kids need, and, moreover, function as "academic gatekeepers" (that's not my terminology) for future academic / life opportunities, including access to college track classes, electives, and university matriculation. We do our students, especially our poor, non-white, ELL students, a disfavor by not adequately preparing them for the manner in which they will be assessed throughout their lives.
In California, student scores fall into one of five ranked categories:
Far Below Basic (FBB)
Below Basic (BB)
Basic (B)
proficient (P)
Advanced (A)
Many educational tools focus only on the number of proficient students. This is near-sighted and harmful. An accurate analysis of these results charts growth. Given a student's starting point, however low, where did they finish? Do you reward the person with the fastest 100m dash time if they started 50m into the race while the competition was 400m farther back? We should look not to where kids finished, but rather how far they traveled.
Here's what my kids did in 2004 and then 2005, when they were in my classroom
Okay. This data shows that 75% of my students started last years scoring in the lowest two categories, and that this number was reduced by nearly half, to 39%. Moreover, zero students were proficient at the start of last year, and by the end 13% were. The students that are represented by that 13% demonstrated over three years growth in a single school year. Not one of them is considered fluent in English by the state of California.
This data makes me happy. Obviously there's a lot of kids still scoring very low, and not quite as much universal movement as I had hoped for, but the amount of kids who jumped from FBB to B in a single year is incredible, and I'm really happy to see that almost half my students (the B's) will enter eighth grade with a shot to finish the year proficient, and therefore entering high school as college track students. The 7% in FBB I thought would be 0-3%, and the 32% in BB I thought would be more like 25%. I can justify some of this -- I had as few as six weeks with some of these kids, two of them should have been in SDC environments, etc. -- but I'll own this data.
Obviously, there is huge room and huge necessity for increased growth, but I think the gains here justified my salary. Moreover, they justify the many alterations, substitutions, and supplements I bring to my terrible scripted, mandated, approved, official curriculum. These results, as imperfect as they are, function as an arrow in thequiver, something I can pull out and say, look, it's working, back off with your passing guides and testing calendars.
posted by Kilian Betlach at 4:25 PM
![]()
![]()


1 Comments:
Your site TMAO, I found to be very interesting. When I was searching for Almanor yours was the most eyecatching. While working on my site Almanor I have been seeking ways to make it better and found yours to be helpful. Thanks!
Post a Comment
<< Home